- ( 0 Reviews )
Checkout Chat2CSV – CSV Data Visualization Tool
Product Description
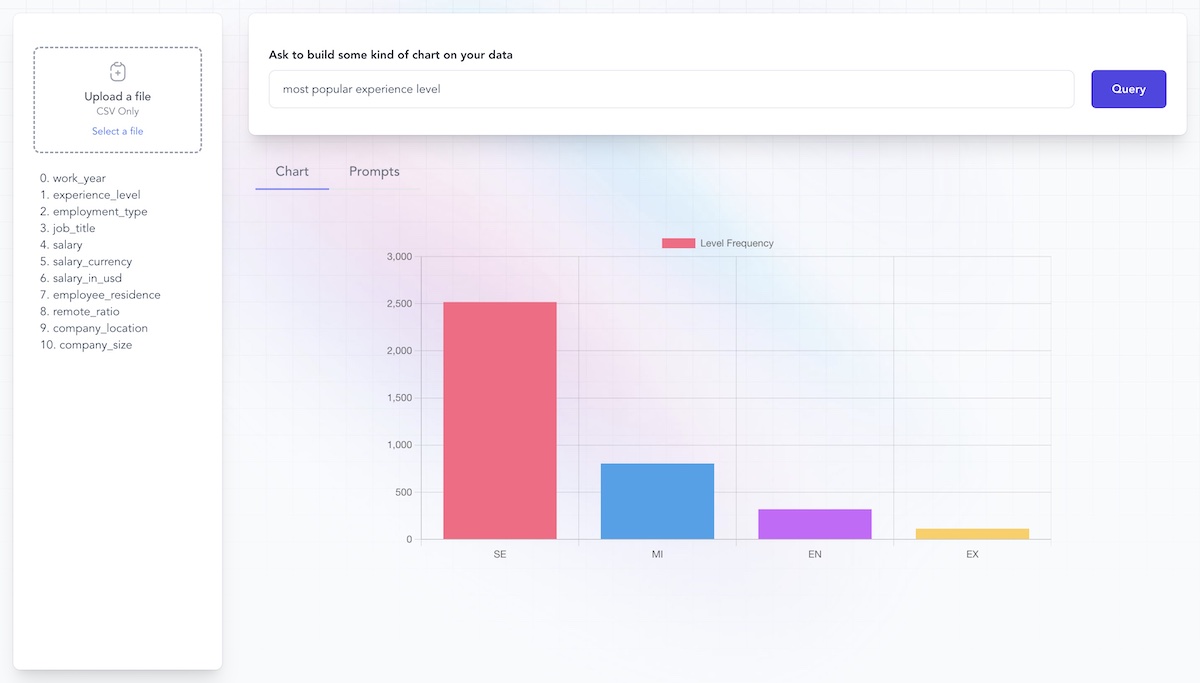
Chat2CSV tool is an AI-powered data visualization platform that enables users to convert their CSV files into various chart types, including pie charts, scatter plots, and line graphs. It utilizes natural language processing to suggest the most suitable chart type for their data analysis needs. The platform prioritizes security and privacy by keeping user data on their own servers while processing only metadata. Its interface is straightforward and requires no coding or scripting skills, making it accessible to all users. The free plan has limited features, while the premium plan offers advanced functionalities at a higher cost.
Other Product Information
- Product Category: Productivity
- Product Pricing Model: Freemium
Ideal Users
- Data Analyst
- Business Intelligence Analyst
- Data Scientist
- Marketing Specialist
- Financial Analyst
Ideal Use Cases
For Data Analyst
- Analyzing customer satisfaction data: As a Data Analyst, one should use Chat2CSV to create a pie chart of customer satisfaction ratings across different products or services to visualize the distribution of customer feedback and identify areas for improvement.
- Tracking sales performance: one should use Chat2CSV to create a line graph of monthly sales data to analyze trends and identify patterns in revenue over time.
- Comparing employee performance: one should use Chat2CSV to create a bar chart of employee productivitytrics, such as sales or customer service ratings, to compare different teams or individuals.
- Analyzing website traffic: one should use Chat2CSV to create a scatter plot of website visitors by source and location to identify where audience is coming from and how they interact with website.
- Visualizing social media engagement: one should use Chat2CSV to create a pie chart of the breakdown of social media followers by platform or demographics to understand which platforms are driving the most traffic to website.
For Business Intelligence Analyst
- Analyzing customer behavior: As a Business Intelligence Analyst, one should use the Chat2CSV tool to analyze customer behavior by creating pie charts and line graphs to visualize sales data and identify trends in customer preferences, purchase patterns, and demographics. This would help understand their buying habits and make data-driven decisions for marketing strategies.
- Tracking website traffic: one should use the tool to create bar charts to analyze website traffic data and identify which pages are performing well and which need improvement, allowing to optimize website design and user experience.
- Monitoring inventory levels: one should use the tool to create pie charts and line graphs to visualize inventory levels and identify patterns in sales and demand for products, helping make informed decisions about restocking and ordering.
- Analyzing employee performance: one should use the tool to create scatter plots to analyze employee productivity and identify areas for improvement, such as sales or customer servicetrics.
- Visualizing financial data: one should use the tool to create line graphs to track revenue and expenses, allowing to make informed decisions about budgeting and forecasting.
For Data Scientist
- Analyzing customer satisfaction data to identify trends in customer behavior and preferences using pie charts and bar graphs to understand their buying patterns and make data-driven decisions for product development or marketing strategies.
- Visualizing sales data using line graphs to track revenue growth and identify areas of improvement.
- Comparing employee performancetrics using scatter plots to optimize workforce management and productivity.
- Analyzing website traffic data using bar charts to understand user behavior and improve website design and user experience.
- Conducting sentiment analysis on social media data using the tool’s AI suggestions for better customer service and engagement strategies.
For Marketing Specialist
- Analyzing customer feedback data to identify trends in customer satisfaction levels across different products or services
- Visualizing sales data to track revenue growth over time
- Comparing customer demographics for targeted marketing campaigns
- Tracking website traffic and user behavior using Google Analytics integration
- Creating social media analytics reports


