- ( 0 Reviews )
Checkout Sloped – Data Dashboard Builder
Product Description
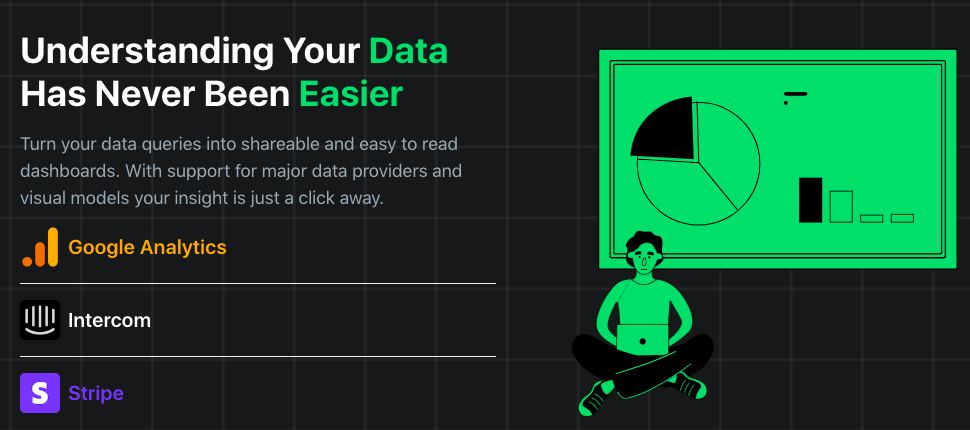
Sloped is a tool that assists users in converting their data queries into shareable dashboards by simplifying the process of visualizing information through its user-friendly interface, supporting various data providers and incorporating AI-driven search capabilities for plain text inquiries.
Other Product Information
- Product Category: Productivity
- Product Pricing Model: Price Unknown / Product Not Launched Yet
Ideal Users
- Data Analyst
- Business Intelligence Analyst
- Data Scientist
- Data Engineer
- Data Visualization Specialist
Ideal Use Cases
For Data Analyst
- Analyzing customer behavior patterns in a retail store by creating interactive dashboards to identify trends and preferences using Sloped’s visual models and shareable features.
- Visualizing sales data for a marketing campaign to better understand customer behavior and optimize strategies.
- Tracking website traffic and user engagement with AI-powered search capabilities.
- Analyzing employee performance metrics and identifying areas for improvement in a business.
- Creating reports on financial data for decision making.
For Business Intelligence Analyst
- Analyzing customer behavior patterns in sales data by creating interactive dashboards to identify trends and opportunities for growth.
- Visualizing website traffic and user engagement metrics using AI-powered search functionality.
- Tracking inventory levels and identifying potential stockouts or overstock situations.
- Monitoring employee performance and productivity metrics.
- Analyzing customer feedback and sentiment analysis to improve customer experience.
For Data Scientist
- Analyzing customer behavior patterns in a retail store by creating interactive dashboards to identify trends and preferences using Sloped’s AI-powered search capabilities.
- Visualizing employee performance metrics for better decision making in a manufacturing company.
- Tracking inventory levels and sales trends in a restaurant business.
- Monitoring website traffic and user behavior on an e-commerce platform.
- Analyzing customer feedback data to improve customer satisfaction.
For Data Engineer
- Analyzing customer behavior patterns in a retail store by creating interactive dashboards using the tool’s AI-powered search feature to identify trends and preferences, allowing for better decision making.
- Visualizing website traffic and user engagement metrics for a digital marketing campaign.
- Tracking inventory levels and sales performance across multiple stores using the tool’s data visualization capabilities.
- Identifying customer demographics and purchase history to improve targeting strategies.
- Analyzing employee productivity and identifying areas for improvement in a manufacturing plant.


